
Product Overview
MedCalc is a statistical software package for biomedical research and healthcare professionals. It provides over 220 statistical tests, procedures, and graphs for data analysis, ROC curve analysis, method comparison, and quality control. Developed for Windows, it includes features for regression analysis, survival analysis, meta-analysis, and the generation of various graphs, with an integrated spreadsheet for data management and support for multiple languages.
Key Features & Capabilities
Statistical Tests: Performs a wide range of tests, including descriptive statistics, ANOVA, t-tests, correlation, regression, and non-parametric tests.
ROC Curve Analysis: A core feature for diagnostic test evaluation, calculating the Area Under the Curve (AUC), sensitivity, specificity, and comparing multiple ROC curves.
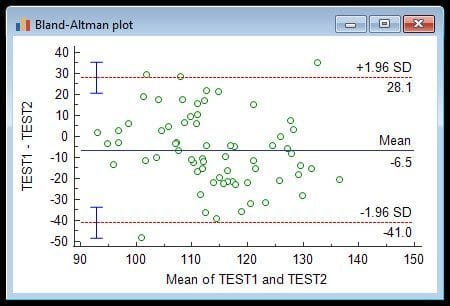
Method Comparison: Includes tools like Bland-Altman plots and Passing-Bablok and Deming regression to compare analytical methods.
Survival Analysis: Offers Kaplan-Meier and Cox proportional-hazards regression for analyzing survival data.
Meta-Analysis: Provides tools for conducting meta-analyses.
Data Management: Features an integrated spreadsheet for data input and can import data from various formats, such as Excel, CSV, and SPSS files.
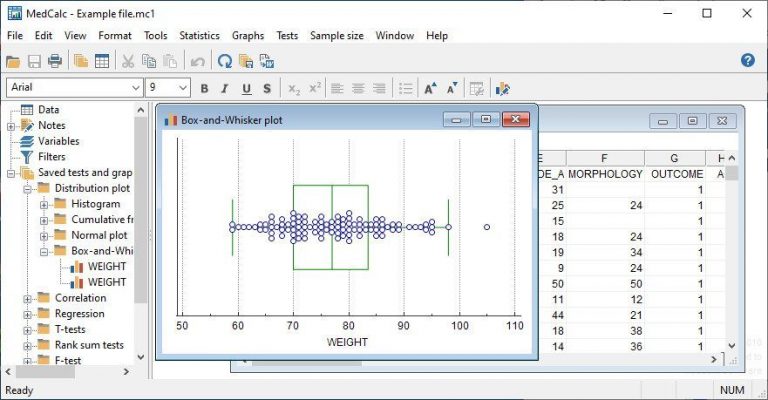
Graphing: Generates various graphs for data visualization, which can be exported.
Who Uses MedCalc?
Biomedical Researchers: Used by researchers in academic and industry settings for data analysis and interpretation.
Healthcare Professionals: Employed by clinicians and other healthcare professionals for clinical research and data-driven decision-making.
Deployment
- On Premises
Pricing
- Subscription
- License Fee
- Price per users
- Free Trial available
More Information
MedCalc Features
Data management
- Integrated spreadsheet with 1 048 576 rows and 16 384 columns.
- Correct handling of missing data.
- Outliers can easily be excluded.
- Built-in WYSIWYG text editor.
- Imports Excel, Excel 2007, SPSS, DBase and Lotus files, and files in SYLK, DIF or plain text format.
- Easy selection of subgroups for statistical analysis.
MedCalc Documentation
- Complete HTML manual on MedCalc web site.
- Comprehensive context-sensitive help.
- Context help in dialog boxes.
Statistical features
ROC curve analysis
MedCalc is the reference software for ROC curve analysis. Our ROC curve analysis module includes:
- Area Under the Curve (AUC) with standard error, 95% confidence interval, P-value. Offers choice between methodology of DeLong et al. (1988) and Hanley & McNeil (1982, 1983).
- List of sensitivity, specificity, likelihood ratios, and positive and negative predictive values for all possible threshold values.
- ROC curve graph with 95% Confidence Bounds.
- Threshold values can be selected in an interactive dot diagram with automatic calculation of corresponding sensitivity and specificity.
- Plot of sensitivity and specificity, or cost, versus criterion values.
- Plot of predictive values versus prevalence.
- Interval likelihood ratios.
- Comparison of up to 6 ROC curves: difference between the areas under the ROC curves, with standard error, 95% confidence interval and P-value.
- Sample size calculation for area under ROC curve and comparison of ROC curves.
Go to the ROC curve analysis section of the MedCalc manual for more information on ROC curve analysis in MedCalc.
Graphs
About the company
MedCalc Software is a developer of medical and statistical software founded in 1993. It’s flagship product, MedCalc Software is a Windows-based statistical software package for biomedical research and healthcare professionals, offering over 220 statistical tests, procedures, and graphs. It is particularly known for its comprehensive ROC curve analysis and tools for method comparison and quality control, and it supports various statistical methods including regression, survival analysis, and meta-analysis.