Product Overview
With a few easy steps you can obtain meaningful numeric results and clean, clear graphics.
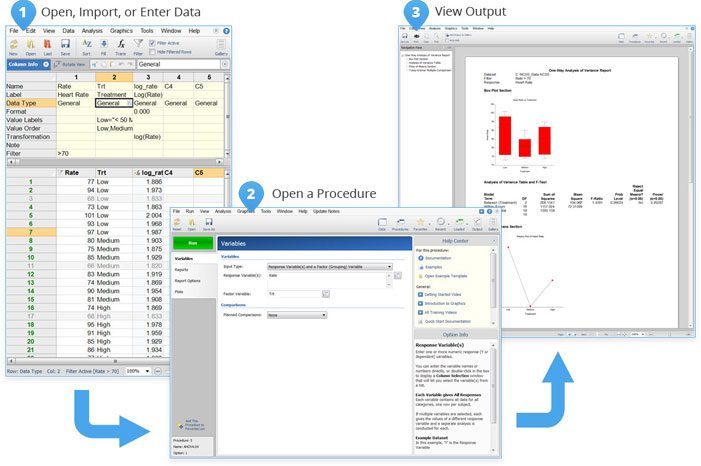
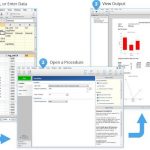
Use the Data window to import or enter your data. Open an NCSS procedure for your desired analysis. Select the columns and run the analysis to obtain accurate and easy-to-read numeric output and graphics.
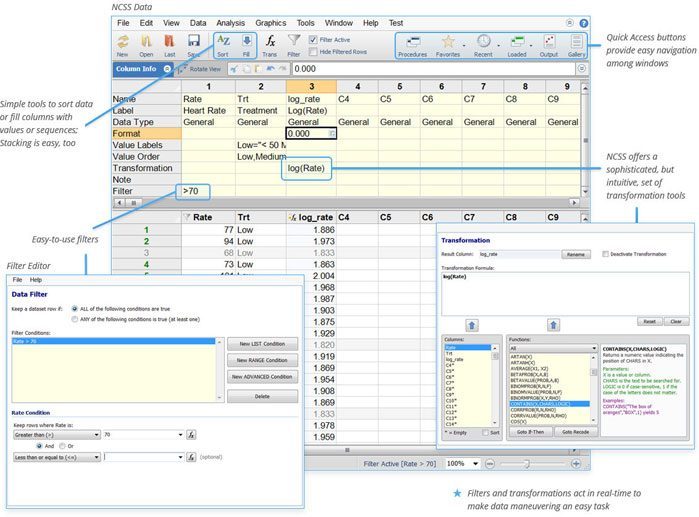
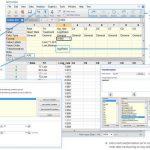
Intuitive Data Management: NCSS readily imports all major types of data files, or you can copy-and-paste your data, or enter your data directly. NCSS has excellent filtering and transformation features for managing your data
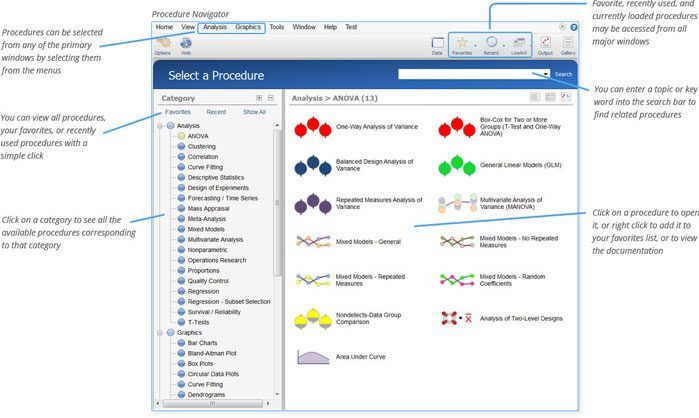
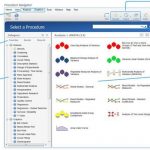
Choosing A Procedure: Finding the right analysis or graphics procedure is easy using the drop-down menu, the procedure search, or the category tree.
Deployment
- Web based
- Cloud Hosted
Pricing
- Subscription
- License Fee
More Information
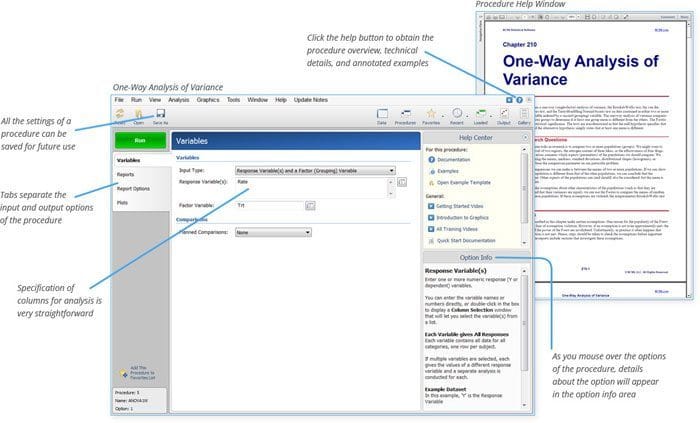
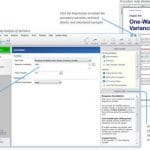
Easy Analysis Set-up: The analysis and graphics tools are easy to use and have built-in help messages for every option. Select the columns to be analyzed, choose the desired reports and plots, and click Run to obtain your results
Elegant Plot Design: There are over 80 plots available in NCSS. Some plots are part of a general analysis procedure such as analysis of variance or regression, while other plots are standalone tools. All NCSS plots are highly customizable. Users are given control of the layout, symbols, titles, legend, axes, grid lines, and more. Plot settings are easily saved for future use or for sharing. A variety of training videos are available through this website, featuring each aspect of plotting in NCSS.
About the company
NCSS was founded in 1981 to supply statistical software to the research community. Since then, tens of thousands of customers have used NCSS software (NCSS and PASS) for statistical, graphics, and power analysis / sample size purposes. The company is led by Dr. Jerry Hintze, an experienced Ph.D. statistician.
For the last 40 years, our mission has been to provide accurate, user-friendly, fully-supported statistical analysis, graphics, and sample size tools. We seek to produce applications the research community requests, as well as new tools to guide improvement in analysis and sample size estimation.


